A desktop Kubernetes client
Your cluster is lying to you.
A crashlooping pod says Running. A Service with a mistyped port draws green and publishes nothing. Rubick reads what the cluster actually does, and tells you that instead.
Free. GPLv3. No account. No telemetry.
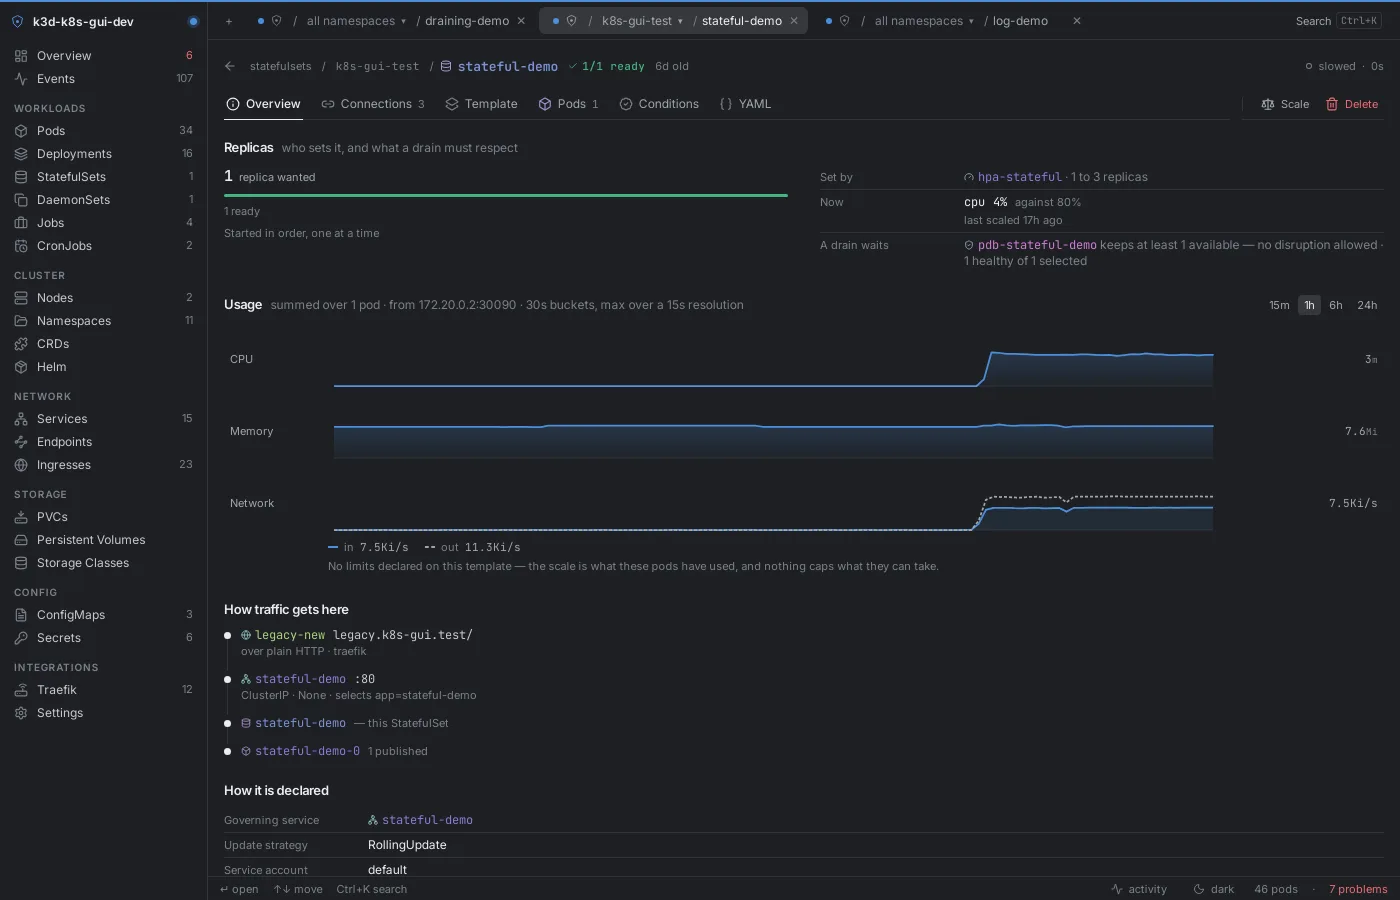
Status: fine, apparently
four lies you have already been told this week.
LIE #1
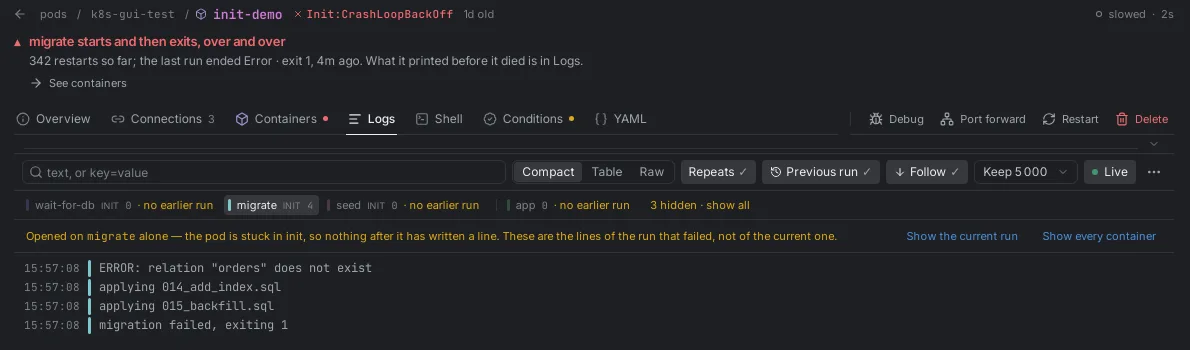
"Running", says the pod.
The container inside has crashed fourteen times. .status.phase does not care, and most dashboards read .status.phase. Rubick derives status the way kubectl does, so a crashloop looks like a crashloop. And when you open the logs they open on the container that failed, at its previous run, not the fresh copy that has not died yet.
We got this one wrong too
The Pods list has derived kubectl's status since 3.0.0. Three of Rubick's own readers still used .status.phase where that status was meant: the port-forward picker, the infrastructure builder and the peek panel's disabled-action sentence. A reviewer saw a crash-looping pod drawn as Running there.
Fixed in 713a2ad, with a corpus of pod shapes both the Rust and the TypeScript evaluator must now agree on. If you find the fourth reader, that is worth an issue.
LIE #2
"All green", says the Service.
Healthy pods, matching selector, one mistyped port name. The Service publishes nothing, and it will stay green all week. Rubick reads the endpoints the cluster actually publishes, not the ones you meant to publish.
selector matches 3/3 pods
LIE #3
"No route to host", says nobody at all.
Somewhere between the Ingress and the pod, the request dies quietly. Rubick draws the whole chain on the workload's own page, and where the path stops it names the reason: a backend that does not exist, a selector matching nothing, pods running but not ready.
This lie on its own page, to send to whoever needs itFour paths on host shop.example.test, no middleware. Slash resolves to three ready pods through Service api-ok. Slash legacy reaches Service api, whose target port name matches no container, so its addresses are published with no port. Slash checkout reaches Service checkout, whose only pod crashes on start and has never been Ready, so nothing is published. Slash api points at Service api-v2, which does not exist in this namespace; inspection stops there. Cluster configuration was inspected; request delivery was not tested.
LIE #4
"Protected", says the namespace.
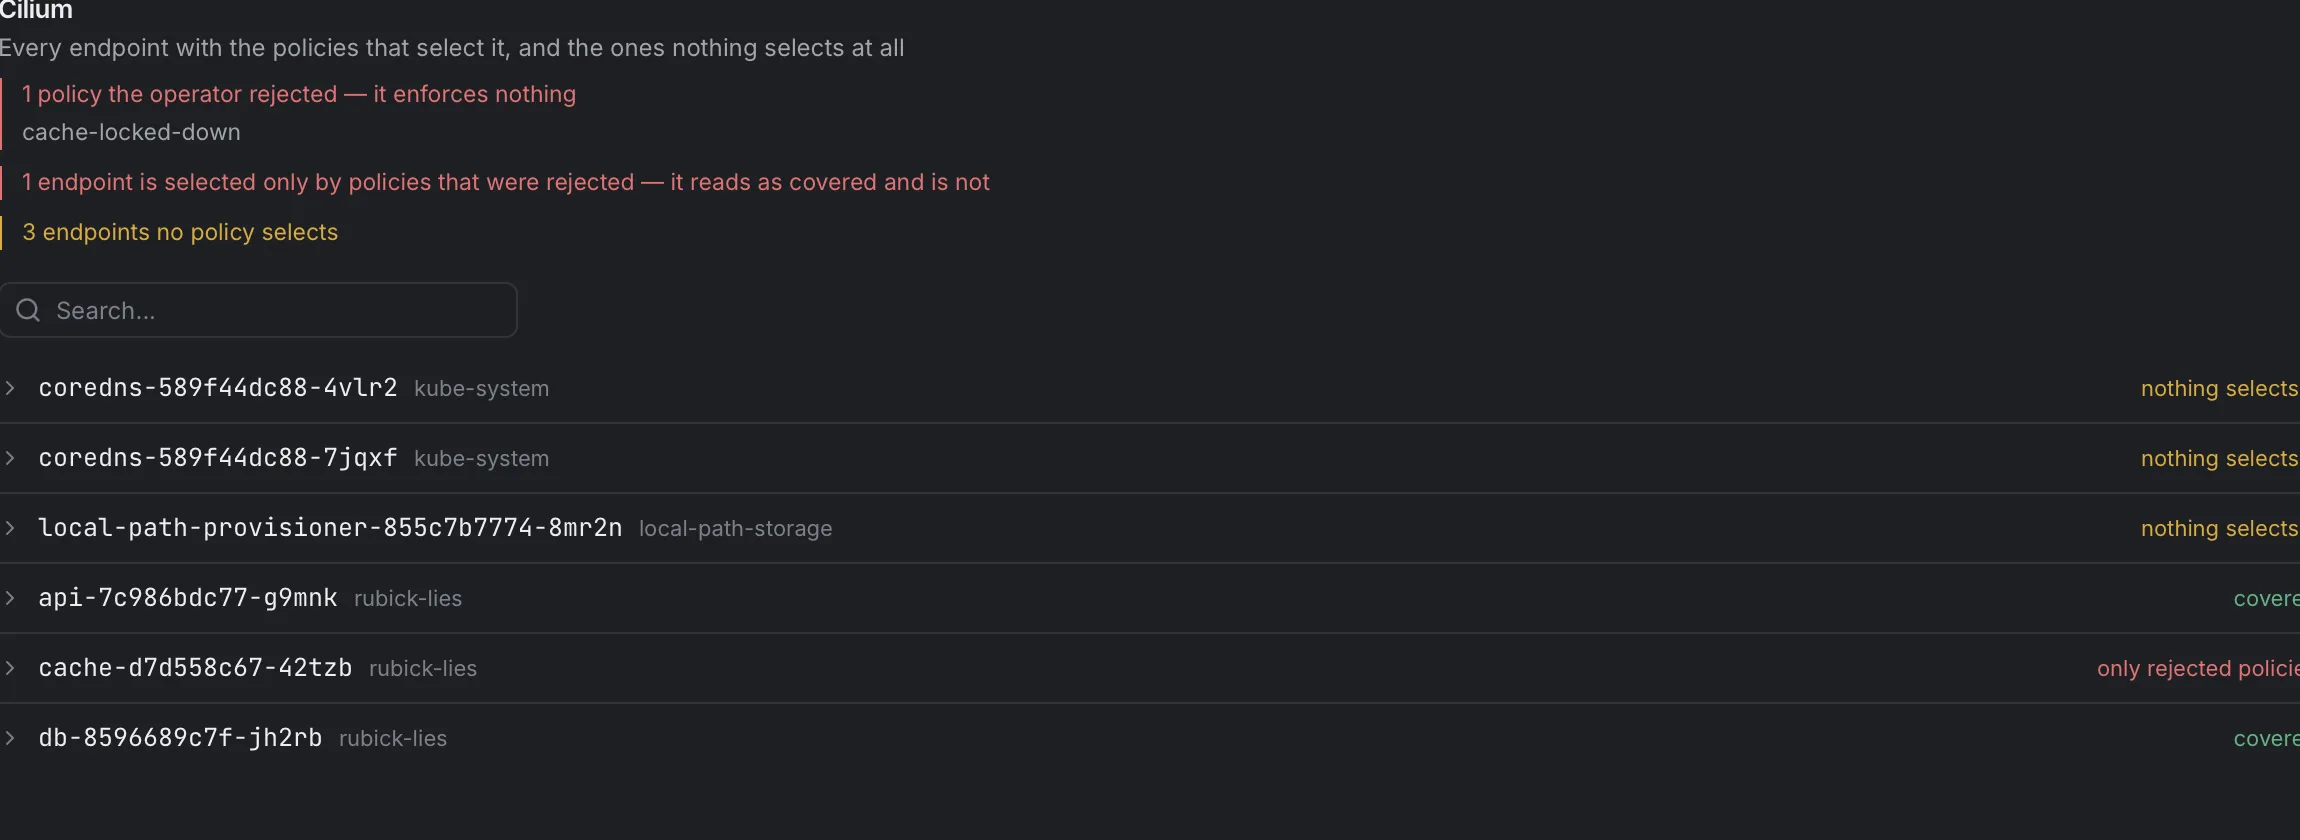
Four network policies in the list, three of them enforced. The fourth has an In operator inside an ingress rule with no values under it, which the Cilium operator cannot parse, so it throws the rule away and keeps the object. The name is the same, the age is the same, and the selector at the top still reads as if it covers those pods, which are now open. The only record is a condition inside the policy's status, and no ordinary list of custom resources shows it. Rubick puts that answer first in the row and names the pods left uncovered.
Valid: False · invalid label selector: matchExpressions[0].values: Required value: must be specified when `operator` is 'In' or 'NotIn'
kubectl get cnp prints a VALID column, so the CLI is not fooled.
Reproduce them
Three of them, one throwaway cluster.
kind or k3d is enough for these three, and no ingress controller is needed: the lies live in the objects, not in the traffic. You get a pod whose phase is Running while its only container crashes on every start, with the ConfigMap, Secret and volume its page will list, a Service whose three pods are Ready and which publishes no port next to a twin Service on the same pods that publishes fine, and one host with four paths: one healthy, one behind the crashlooping pod, one behind the mistyped port, one pointing at a Service that does not exist.
kubectl apply -f https://rubick.tech/lies.yamlkubectl -n rubick-lies get pod,svc,endpointslice,ingresskubectl delete -f https://rubick.tech/lies.yaml# kubectl reads the same objects Rubick does, so it is not fooled either. The dashboards that are fooled read .status.phase, or the selector, or the rule, and stop there.
Connections
One page, everything it touches.
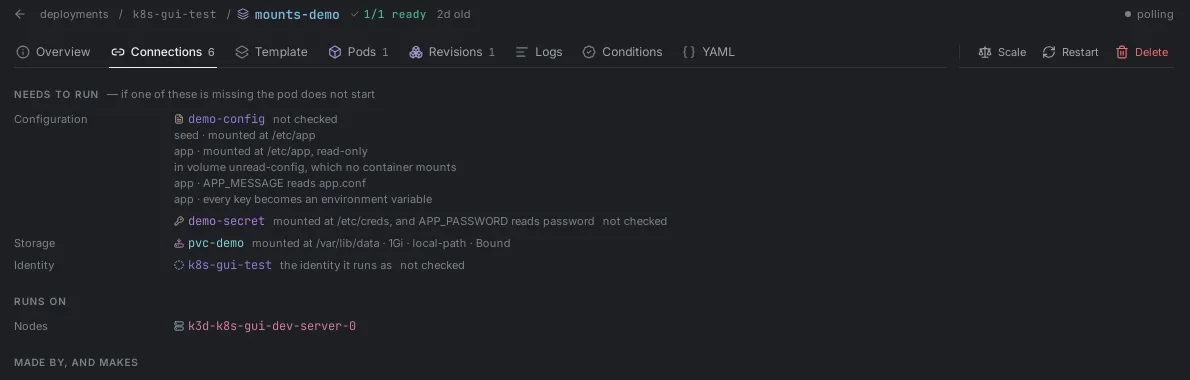
Open a pod and its neighbourhood is already there: the Ingress and Service in front of it, the ConfigMap it reads, the Secret it mounts, the volume it claims, the node it landed on, and by name the kinds nobody asked about. Every neighbour is a page of its own, one click away, with its own neighbours. This is the checkout pod from the fixture, as read on a k3d cluster. Click through it.
rubick-lies · 1 container · 3 restarts and counting
Traffic chain · on the Overview, drawn from the entry point down
A Gateway listener and an HTTPRoute draw the same chain from the listener down. The fixture uses an Ingress so it needs no CRDs.
Needs to run · if one of these is missing the pod does not start
Runs on
Not looked at · named, so a group that is absent is never read as a group that is empty
the kinds this page did not readlisted by name, with the reason, instead of left as a gap
Every object the fixture creates, and the one it only mentions, each drawn in the groups its own Connections tab uses. What the tab does not show is not drawn here either.
Before you act
It warns before it obeys.
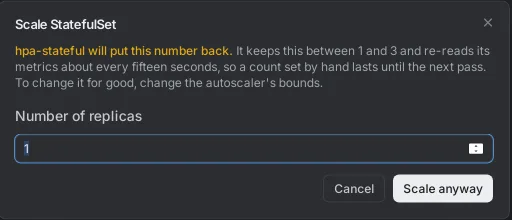
Scale, Restart, Delete and Edit YAML tell you who will undo your change and how fast. An autoscaler, in seconds. Argo CD or Flux, in minutes. Then it does what you asked anyway, because a hand edit during an incident is legitimate and you are an adult.
The third answer
Nothing there, or nobody looked?
A list that came back empty, a list the cluster refused to give, and a list nobody asked for draw the same green zero on most dashboards. Rubick keeps the three apart, because two of them are not answers.
Looked, and it was empty
- most dashboards
- 0 Gateways
- Rubick
- 0 Gateways
The list was read and came back empty. This is the only one of the three that means what the zero says.
Asked, and was refused
- most dashboards
- 0 Gateways
- Rubick
- You do not have permission to list these
The cluster answered 403. Whose decision it was is the one fact that makes it actionable, so that is what the row says.
Never asked
- most dashboards
- 0 Gateways
- Rubick
- Not looked at
Named, so a group that is absent is never read as a group that is empty. A gap on a page is a claim; this is not.
Try it yourself
Would you call this Running?
Start with the reported phase. Read the container states. Pick the status you expect inspection to leave standing.
Pod status fragment
1 of 6
containerStatuses[0]
- state
- waiting
- reason
- CrashLoopBackOff
- exitCode
- not reported
- signal
- not reported
- ready
- false
After inspection
CrashLoopBackOffcontainerStatuses[0].state.waiting.reason is CrashLoopBackOff; the first container verdict replaces the phase.
Six shapes the Rust and TypeScript evaluators must agree on, not proof of universal agreement with kubectl.
Also in the box
The boring parts, done properly.
Logs
Virtualised, multi-container, filtered server-side, repeats collapsed. They open where the answer is.
Shell
A real terminal tab per pod. The session survives you looking elsewhere.
Gateway API
Gateways, all five route kinds, classes, policies. A route that is not serving says which of the eight links between listener and pod broke.
Secrets
Binary values shown as binary. Private keys never revealed. Boring on purpose.
Custom resources
Every CRD in the cluster, with YAML editing and validation. Yours included.
Helm
Releases, revisions, rollback, uninstall. No opinions about how you got here.
Extensions
It knows what you installed.
Detected integrations need nothing from you. Their CRDs are in the cluster or they are not. Configured ones need an address, and Rubick never goes looking for one.
- Traefik / ingress-nginx / Istio
- hosts, rules and middleware read as routing, annotations turned into sentences with the raw key beside each
- cert-manager
- expiry wherever TLS is named, and the issuance chain when renewal fails
- Argo CD / Flux
- every object says whether it is delivered, from which revision, and whether your edit will survive
- Prometheus
- real history, disk fullness, network traffic
- Loki
- logs that outlive the pod that wrote them
- GKE / EKS / AKS
- node pools, machine types, spot status, read from labels with no cloud account
Adding one costs a folder and a line. See CONTRIBUTING.
Where it runs
Any cluster your kubeconfig can reach.
Your kubeconfig names the cluster and the credentials. Rubick reads it and signs in the way kubectl does, OIDC and exec plugins included. Settings, Diagnostics names the directories it searches for a plugin and which ones resolve, so a plugin your terminal finds and the app does not is a named problem, not a blank screen. Kubernetes 1.21+ is required.
GKE
How it signs in
gke-gcloud-auth-plugin
A GKE exec kubeconfig names this plugin to get a token. Rubick reads that configuration.
What Rubick reads there
The context name identifies the GKE flavour. Node labels name the pool and spot or preemptible capacity.
- cloud.google.com/gke-nodepool
- node pool
- cloud.google.com/gke-spot
- spot when true
- cloud.google.com/gke-preemptible
- preemptible when true
- cloud.google.com/gke-provisioning
- spot or preemptible
EKS
How it signs in
aws eks get-token
An EKS exec kubeconfig can name this command to get a token. Rubick uses the configured command and credentials.
What Rubick reads there
The context ARN or EKS name identifies the EKS flavour. Labels name managed node groups; Karpenter labels name the pool that made its nodes.
- eks.amazonaws.com/nodegroup
- node group
- eks.amazonaws.com/capacityType
- spot, compared without case
- karpenter.sh/nodepool
- Karpenter pool
- karpenter.sh/provisioner-name
- older Karpenter pool
- karpenter.sh/capacity-type
- spot when spot
AKS
How it signs in
kubelogin
An AKS exec kubeconfig can name kubelogin to get a token. The credentials come from your kubeconfig setup.
What Rubick reads there
The context name identifies the AKS flavour. Labels name the agent pool and spot capacity.
- kubernetes.azure.com/agentpool
- agent pool
- kubernetes.azure.com/priority
- spot when spot
- kubernetes.azure.com/scalesetpriority
- older spot label
k3s
How it signs in
Client certificate or token
Rubick uses the credentials in your kubeconfig, as kubectl does.
What Rubick reads there
A k3s word in the context name reads as K3S before cloud names are considered. This integration adds no provider-specific node label keys.
k3d
How it signs in
Client certificate or token
Rubick uses the credentials in your kubeconfig, as kubectl does.
What Rubick reads there
A context starting with k3d- reads as K3D, even if its name also says eks. This integration adds no provider-specific node label keys.
kind
How it signs in
Client certificate or token
Rubick uses the credentials in your kubeconfig, as kubectl does.
What Rubick reads there
Rubick reads Kubernetes objects through the configured context. There is no kind-specific flavour or node label reader in the integration registry.
minikube
How it signs in
Client certificate or token
Rubick uses the credentials in your kubeconfig, as kubectl does.
What Rubick reads there
A context name containing minikube reads as LOCAL before cloud names are considered. This integration adds no provider-specific node label keys.
Anything else with a kubeconfig
How it signs in
Token, certificate, OIDC or exec plugin
Your kubeconfig states how to authenticate. Rubick uses those credentials to reach the Kubernetes API.
What Rubick reads there
Kubernetes objects and recognised node labels, where present and permitted. An unrecognised label does not establish a cloud, pool or spot status.
Shared node labels, with no cloud account
Machine types, zones and regions come from these node labels when present. Pool and spot labels are read across providers, including Karpenter. Reading them needs access to the Kubernetes nodes, with no separate cloud account.
- node.kubernetes.io/instance-type
- machine type
- beta.kubernetes.io/instance-type
- older machine type
- topology.kubernetes.io/zone
- zone
- failure-domain.beta.kubernetes.io/zone
- older zone
- topology.kubernetes.io/region
- region
- failure-domain.beta.kubernetes.io/region
- older region
Rubick is developed every day against a GKE cluster; AWS and Azure are the least exercised paths. If something reads wrong on yours, that is worth an issue.
Social proof
What people are saying.
Nothing. Nobody has said anything yet.
We could have written some quotes here and put smiling faces next to them. It felt off-brand for a product whose entire personality is not lying to you.
The first thing this box will ever show is a report of a status we got wrong, and what we did about it.
Scope, defended
Features we are proud to not have.
- no
Cost estimates
Spot pricing and negotiated rates make them wrong more often than right, and a wrong number about money poisons the right ones.
- no
A whole-cluster topology graph
A force-directed blob looks like insight and answers nothing. Routing is a chain in a fixed order, so that is what you get.
- no
Editing routes or renewing certificates
Reading them well is a feature. Writing them has a different blast radius. An ACME rate limit is five failures an hour.
- no
Guessing
If a name in a log line might be an object, it stays text. Anything never asked about says "not looked at" instead of leaving a gap that reads as "nothing there".
License
Steal our code. Legally.
GPL-3.0-or-later. Fork it, change it, ship the source with it. Running it at home or across your whole company is not distribution and obliges you to nothing.
- license
- GPL-3.0-or-later
- runtime
- Tauri, Rust, kube-rs. React on top. No Electron.
- account
- none
- telemetry
- none
Install
Get it.
brew install --cask Dudude-bit/tap/rubick# signed with a Developer ID certificate, notarised by Apple. Opens on a double-click, like software should.
# or take the .dmg straight:
The installer is not signed, so SmartScreen will warn you on first launch. More info, then Run anyway.
We would rather tell you that here than let the dialog surprise you.
# Arch: rubick-kubernetes-bin is on the AUR, maintained by @Prototik from the same .deb we publish. Thanks to him for it.
Every version, with signatures, lives on GitHub Releases.
It talks to your clusters, and to GitHub to check for updates. Nothing else. There is nothing else to talk to.